
This week we were tasked with generating light curves for the targets in our images and writing an annotated bibliography for a paper we were assigned in groups. My group was assigned “Accretion in low-mass members of the Orion Nebula Cluster with young transition disks” (de Albuquerque et al. 2020).
Taurus field light curves
We divided our Taurus targets between our group members after we had generated a target property table (below). We accomplished this by overlaying RA and Dec coordinates over a deep R-band image (using the tool astrometry.net) and using an algorithm from last semester’s course to determine the positions of each star in our image, we created a list of the RA and Dec for each star in our field. We then fed this list of coordinates to a VizieR catalog (specifically the catalog from Esplin et al. 2019, which is a recent survey of all known Taurus members), which returned a table of objects in the Esplin+ 2019 catalog that matched the positions of the stars in our image.
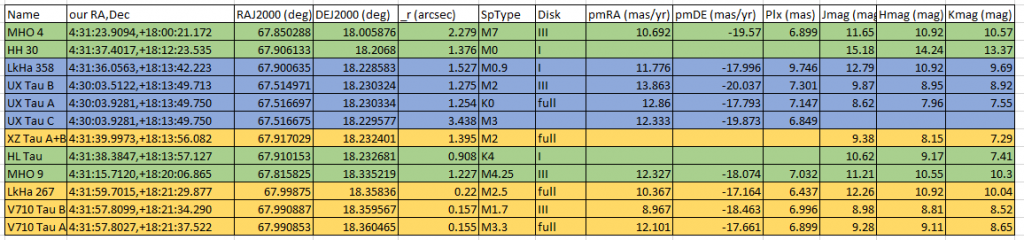
Then, I imported my series of preprocessed image files into AstroImageJ. I placed apertures over my targets first before selecting ~20 comparison stars from the four edges of the field (the dust in the center of the frame extincts most stars there). Frustratingly, the PSFs for V710 Tau A and B are blended together, and AIJ will only place an aperture somewhat over the brighter of the two; that’s something I’ll need to pay attention to moving into using other methods for creating light curves later. It appears the data for night 7 cycle 2 is still producing poor results, even after I went back and realigned it. I might just have to throw out that dataset (the logs say it was particularly bad seeing, and a visual check confirms that). Lena and my light curves agree fairly well, but I am concerned that her fluxes don’t vary between cycles, only by night.
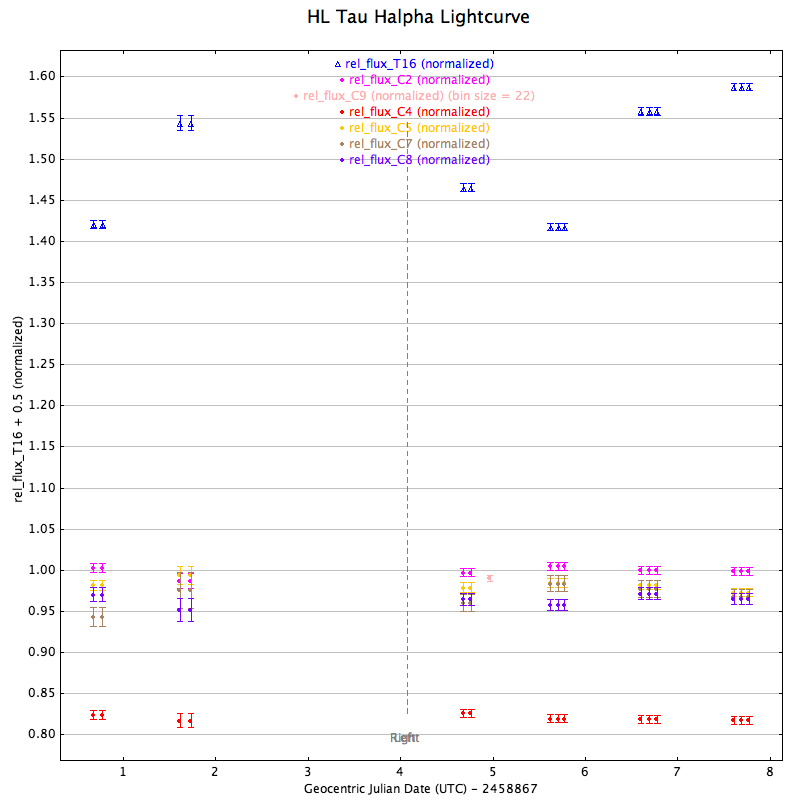
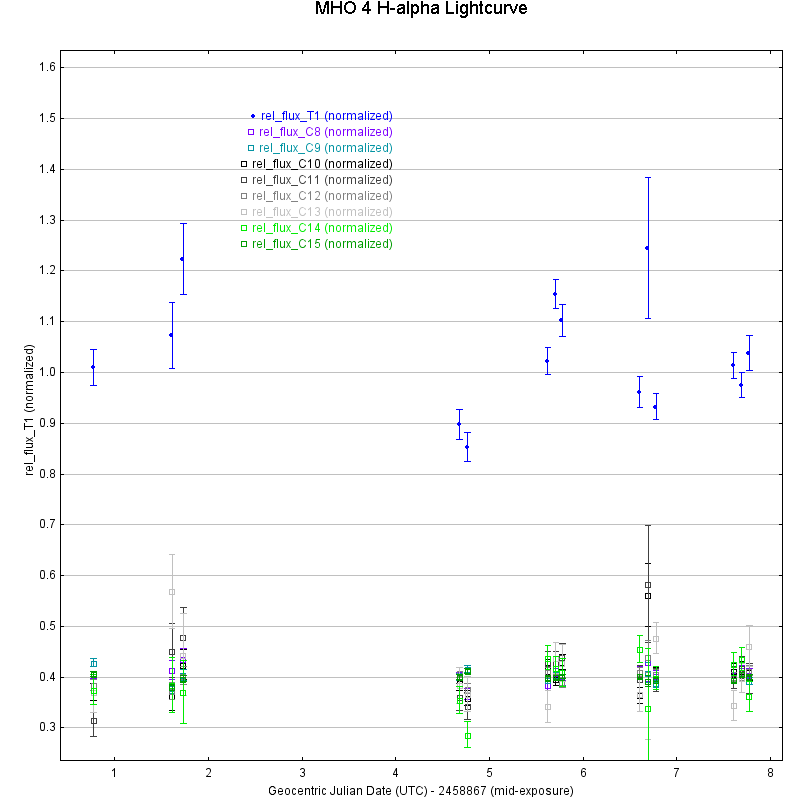
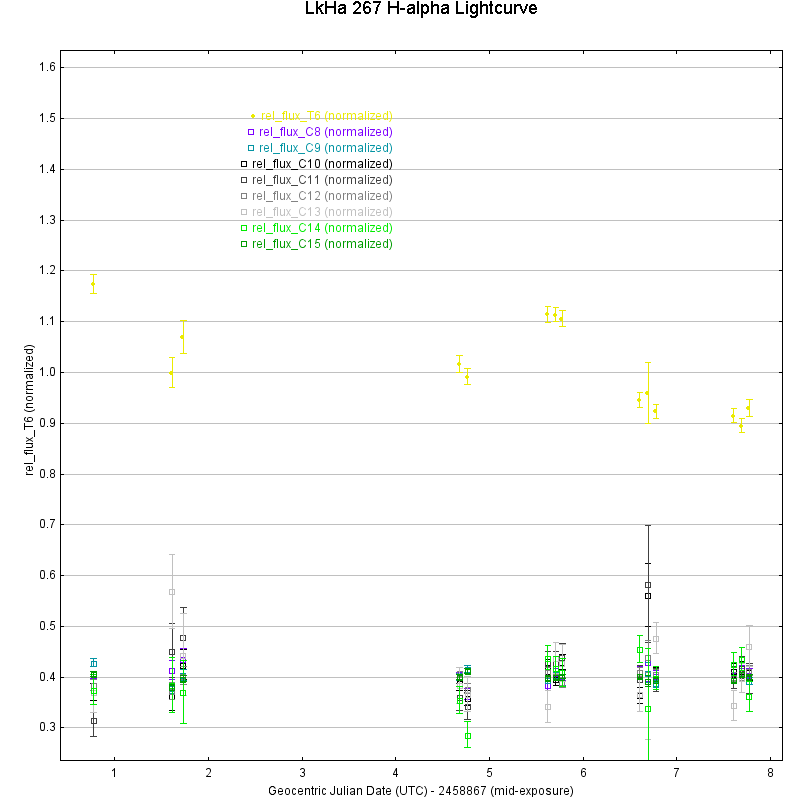
Our gallery of Ha light curves is included below.


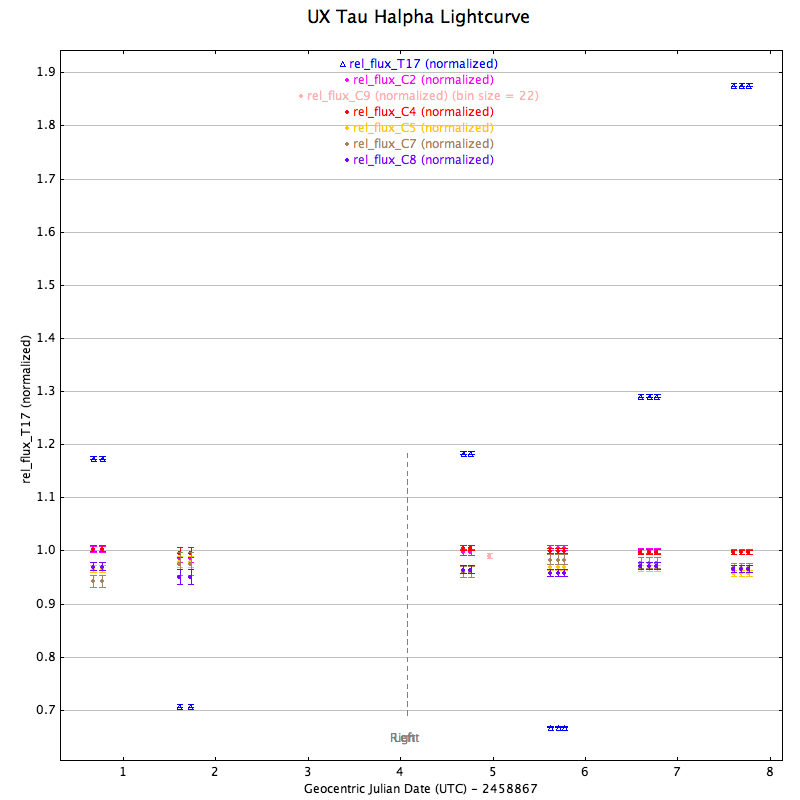
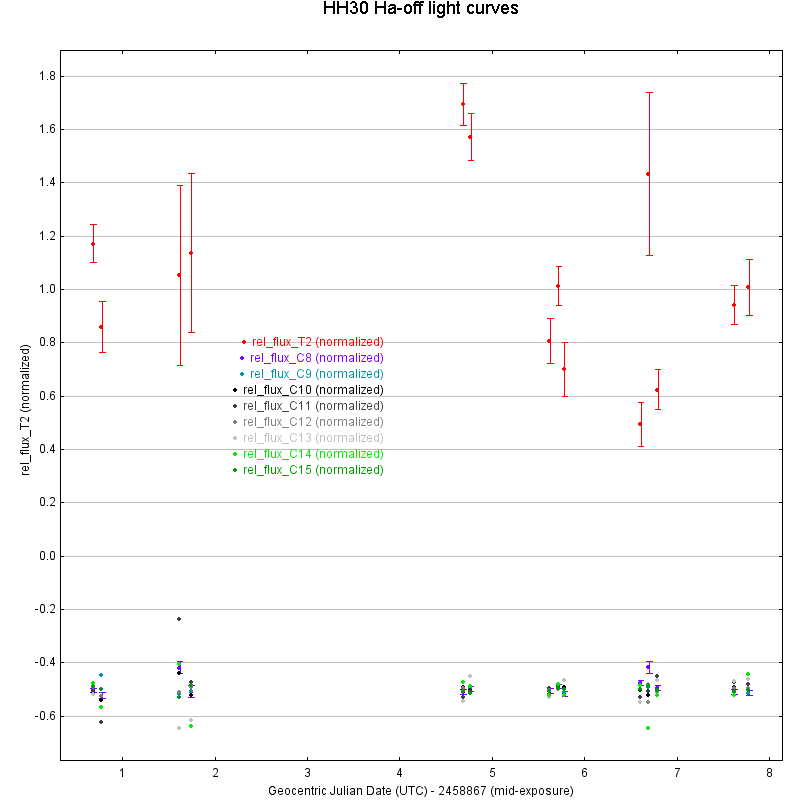
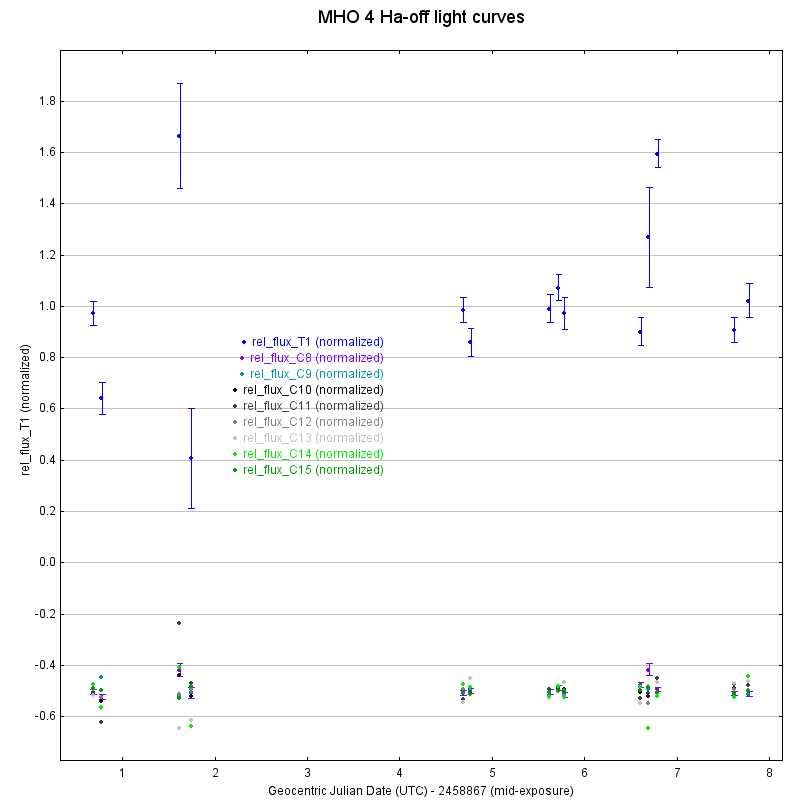
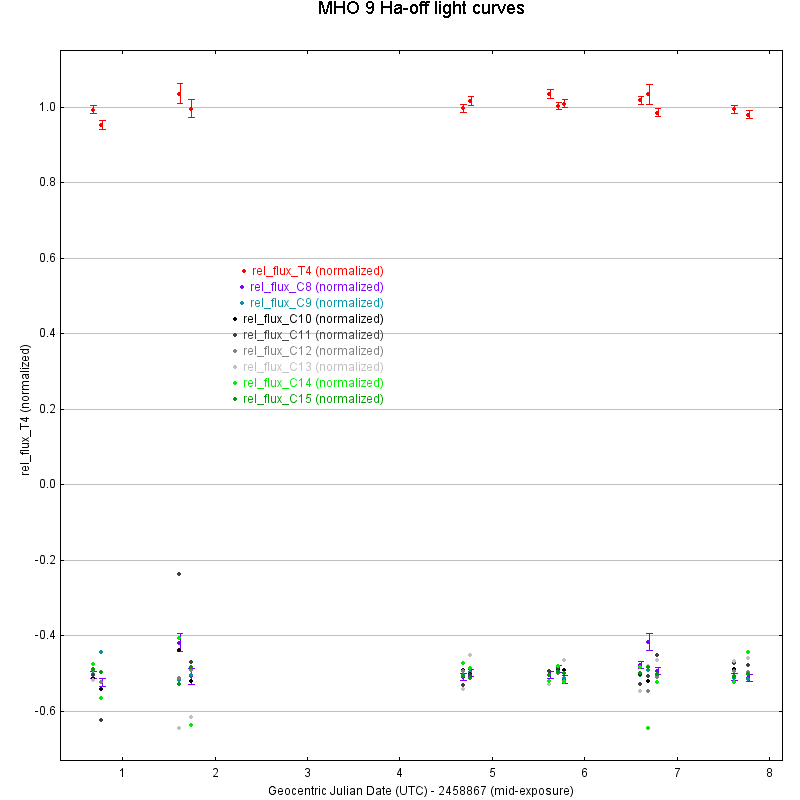
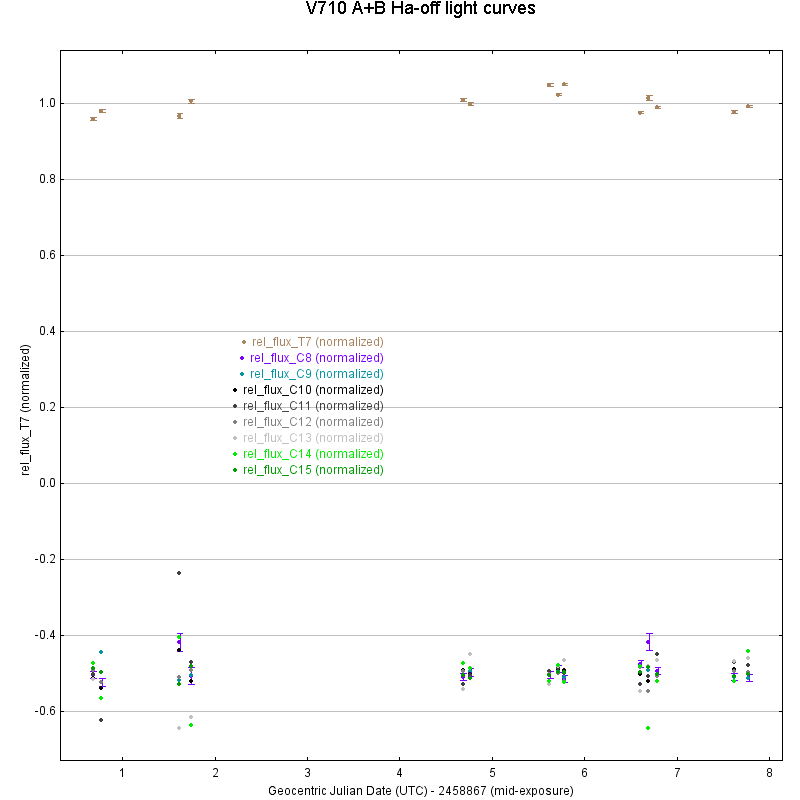
Nearly as important as the Ha light curves is our comparison wavelength, dubbed ‘Ha-off.’ Below are the lightcurves for our targets in that wavelength as well.


TESS field light curves
TESS was more frustrating because the targets in it were so dim, that most of the important ones (Brown Dwarfs) didn’t appear in our images. We’re currently in consultation with Kim about this, so more to come later.
Annotated Bibliography
Attached here is my annotated bibliography for de Albuquerque 2020
Leave a Reply